2023 was the warmest year on record. As the effects of climate change are seen around the world, there has been an increasing concern about the health impacts of these changes. Additionally, there is a need for better data on how changing environmental conditions affect health service delivery and health seeking behaviors in different geographies.
We wanted to leverage our widely-distributed digital health service, PROMPTS, to understand the impact of these changes on pregnant women and new mothers in Kenya.
PROMPTS is a text messaging service that empowers mothers to seek care at the right time and place. It combines a series of nudge messages that influence key health seeking behaviours tied with better outcomes, and an AI-enabled helpdesk that responds to questions and sparks a rapid referral chain if a risk is identified.
Over four years, PROMPTS has reached ~3M pregnant women and new mothers across Kenya. Every day, we receive ~6,000 incoming questions from PROMPTS users. Since PROMPTS uses AI to read, categorise and prioritise incoming messages from mothers, we are able to create snapshots of their pregnancy based on the subject matter of their text messages.
Extreme heat is one of the most widely experienced indicators of climate change. It has a direct health impact through heat stress leading to heat stroke, heat exhaustion and cardiovascular disease, but can also indirectly impact health through associated drought, food insecurity and malnutrition.
We wanted to answer three questions:
- Do we have enough data about PROMPTS users’ exposure to extreme heat?
- Are we able to detect changes in the PROMPTS user conversations during periods of extreme heat?
- What opportunities are there for PROMPTS to support pregnant women and new mothers during periods of extreme heat?
Do we have enough data about PROMPTS users’ exposure to extreme heat?
We were able to record differences in the duration of extreme heat experienced by PROMPTS users, who use the service from geographically diverse parts of Kenya.
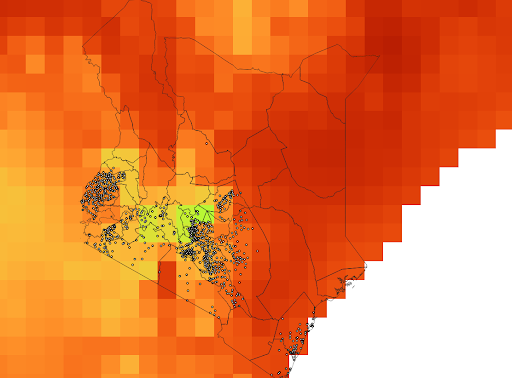
Approach: PROMPTS is operational across 22 counties in Kenya. In 2023, over 200,000 active* users (*asked questions, responded to surveys) were texting into our helpdesk from locations across the country (Figure 1). We obtained the daily maximum temperature (Tmax) across these counties as GIS data that corresponds to 0.5 latitude x 0.5 longitude grids (0.5 is approx 55km, see boxes in Figure 1).
We then tracked the facilities where women sign up to PROMPTS (dots on Figure 1), and identified 1,063 facilities associated with users who texted into the service between Jan 1 and Dec 31 2023. By overlaying facility locations with Tmax grids, we were able to extract the daily maximum temperature experienced at each facility location during 2023. We used this as a proxy for temperatures experienced by PROMPTS users at that location.
Results: PROMPTS enrolment locations, and the users living in those areas, experienced varying durations of extreme heat throughout the year. We used two heat thresholds of >30 degrees C and >35 degrees C. PROMPTS users experienced an average 85.53 days of temperature >30 degrees, and an average 3.65 days of temperatures >35 degrees.
A majority of locations (85%) experienced at least 1 day with Tmax>30 degrees, while 22% experienced Tmax >35 degrees.
This geographic diversity of PROMPTS users, and the associated variance in extreme heat exposure, means we have a dataset that is potentially sensitive enough to detect changes in experiences and care seeking that can be linked with climate change.
Are we able to detect changes in the PROMPTS user conversations during periods of extreme heat?
We found that extreme heat is associated with an increase in ‘danger signs’ or high priority questions from PROMPTS users.
Questions from PROMPTS users incoming messages are assigned an intent (or topic) that is classified using AI, have a date and time stamp, and have an associated priority level that has been predefined by the clinical helpdesk team, based on intent.
Pregnant women and new mothers ask about a wide range of topics, from diet to baby milestones, but also about experiencing bleeding or blurred vision and severe headaches. Our AI is able to recognize 103 intents with high accuracy (share refs).
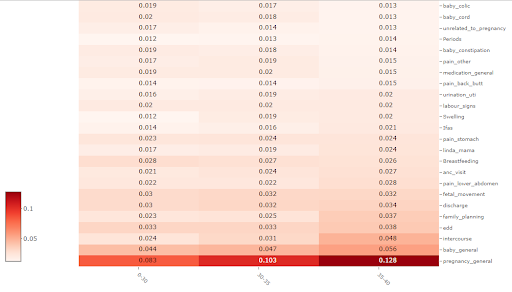
We cross referenced incoming messages with the associated maximum temperature experienced that day, and analyzed the data using temperature bins <30 degrees C, 30-35 degrees and 35-40 degrees C. The majority (80%) of messages are received on days where the maximum temperature is <30 degrees C, 19% are associated with max temperature days of 30-35 degC and <1% are associated with 35-40 degree days.
When we investigate the relative distribution of intents within the temperature bins, we see changes in the frequency of specific intents (Figure 2). General questions about pregnancy and newborns, questions related to intercourse, pain, swelling and urinary tract infections increase at higher temperatures. The effect is modest, but statistically significant.
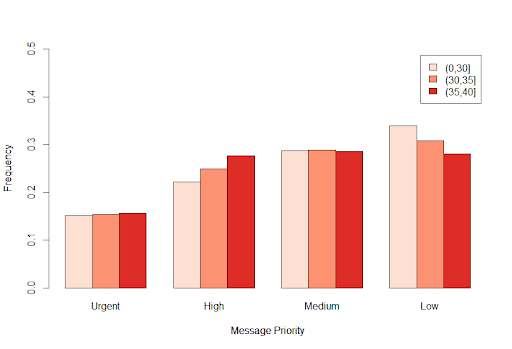
As described above, PROMPTS assigns a priority level to intents, which range from urgent priority (mum reports bleeding) to low priority (mum asks a question about nutrition). When we investigate the frequency of message priorities, we see a slight decrease in the frequency of low or medium priority messages at higher temperatures, and a slight increase in high/urgent priority messages.
What opportunities are there for PROMPTS to support pregnant women and new mothers during periods of extreme heat?
We have a lot more work to do to validate and dig into these insights. However, this should not come as a surprise – high heat stress is likely to lead to more clinically concerning events.
How do we support mothers during times of extreme heat stress?
- Proactively reach out to mothers during heatwaves: We are able to send out targeted campaigns to mothers based on their location. These campaigns could involve behavior adaptations and advice during periods of high heat and humidity (e.g. drinking water, avoiding exertion). PROMPTS also tracks risk factors associated with mothers (e.g. history of hypertension or gestational diabetes), and targeted messaging can be sent to individuals who are at higher risks during periods of extreme heat.
- Proactively reach out to facilities during heatwaves: Jacaranda works closely with the county health and facility managers who operate the network of government, faith-based and private facilities where PROMPTS mothers seek care. We can advise these facilities on how best to support their clients (and staff) during periods of extreme heat, e.g. rethinking the facility clinic hours to operate during cooler hours of the day.
Conclusion
We believe that PROMPTS provides insights into pregnancy and postpartum care as experienced through the lens of global climate change. This is an initial attempt at documenting early insights into the link between maternal and newborn health and climate change.
We will continue to explore this data, repeating the analyses over the course of time and expanding to look at other climate change related indicators, to help policymakers and scientists advocate for vulnerable populations.