Challenge we’re addressing
In Kenya, poor quality care is compounded by a data gap.
Few formal channels exist for mothers to have a say on their experiences of care, and local and county governments lack real-time insights on the gaps in the services and systems that support mothers and babies. Meanwhile, the perspective of frontline nurses is also missing. The result is an imperfect picture of quality of care, and resources do not reach where the need is greatest.
How this works
Kenyan county governments using our dashboards
data review meetings to assess and act on data
weekly logins to dashboards by facility and county partners
We track what mothers ask us and self-report on PROMPTS to understand risks, optimize referral, and better understand quality of care from the client’s perspective and monitor how frontline nurses and midwives are performing through MENTORS to understand gaps in critical skills within facilities.

Which essential prenatal care steps were missed?
How does respectful maternity care differ across facilities?
What specific skills and knowledge gaps exist amongst providers?
Are facilities adequately equipped to handle emergencies?

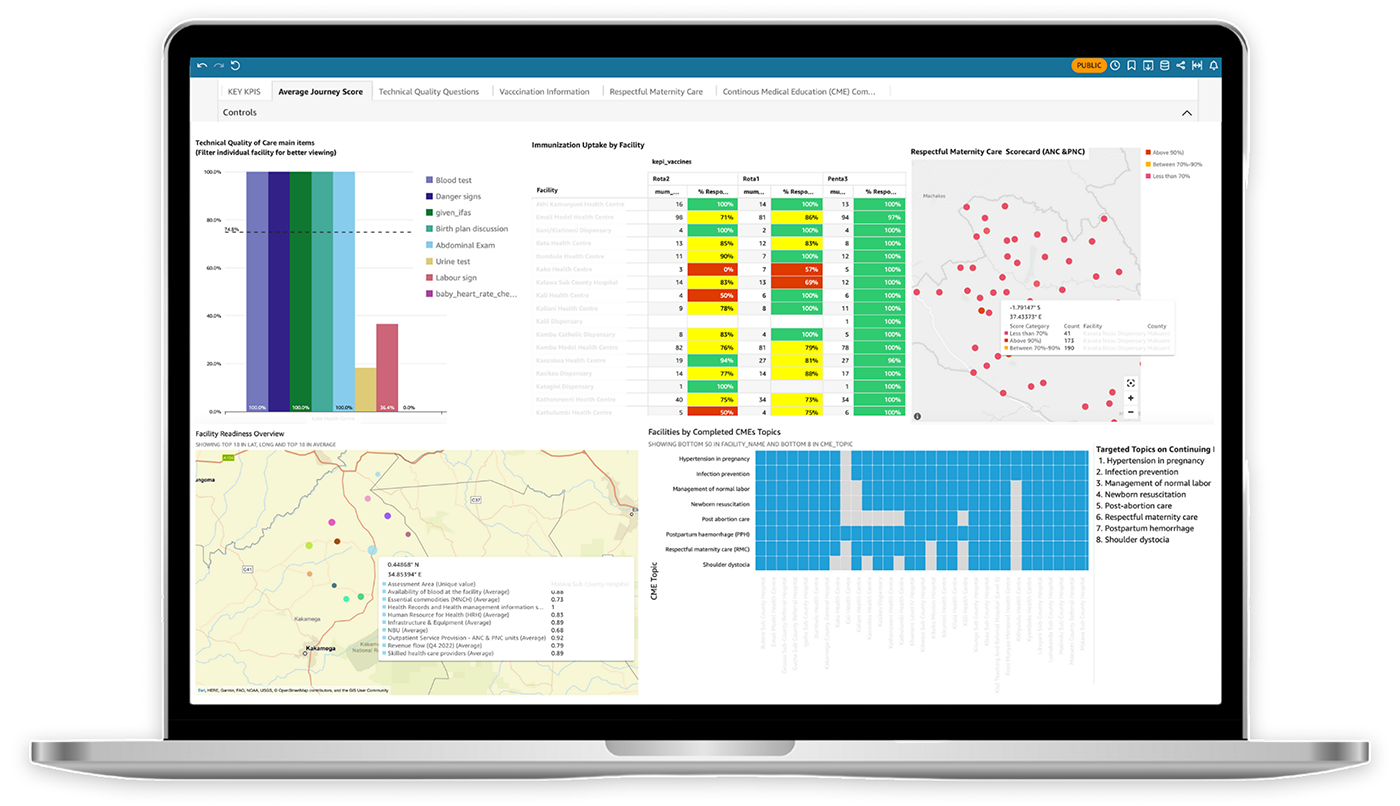
After each prenatal check-up, PROMPTS asks mothers whether they received the appropriate clinical steps, from taking a urine test to having an abdominal exam. This feedback helps track and standardize the clinical quality of prenatal care across facilities, and dig into issues, from clinical and informational gaps, to systemic gaps like medicine stock-outs.
PROMPTS routinely nudges mothers to share feedback on their experiences of care in facilities, including disrespectful care, lack of privacy, refusal of services, or discrimination. The feedback is aggregated into a map, helping rapidly identify and address ‘hotspots’ of disrespectful care.


We’re able to connect what mothers are reporting with data from MENTORS on the skills of nurses on the ward. Our dashboards offer facility-level insights on gaps in essential EmONC skills and knowledge, incentivizing continuous improvements.

We co-design dashboards with our government partners to give them usable and useful data on health system gaps to complement national data systems, and to help them own them in the long term. Facility and government leaders help us decide what metrics we measure, and how the dashboards should look to help them easily identify and address ‘red flags’. Each month, we share these dashboards with facilities and county health leadership, and host routine data review sessions to support and monitor improvements based on gaps identified by data.

When the Head Nurse at Ruita Health Center noticed reports of women being turned away without services or explanation, she mobilized a quality improvement team to investigate. Commodity and staff shortages emerged as leading drivers. The team used data from Jacaranda’s Quality of Care report to lobby for funds to stock their lab and pharmacy, conduct follow-up calls with mothers to understand their experiences, and maintain consistent staff at the prenatal clinic. In six months, prenatal care coverage rose from 42% to 85%.
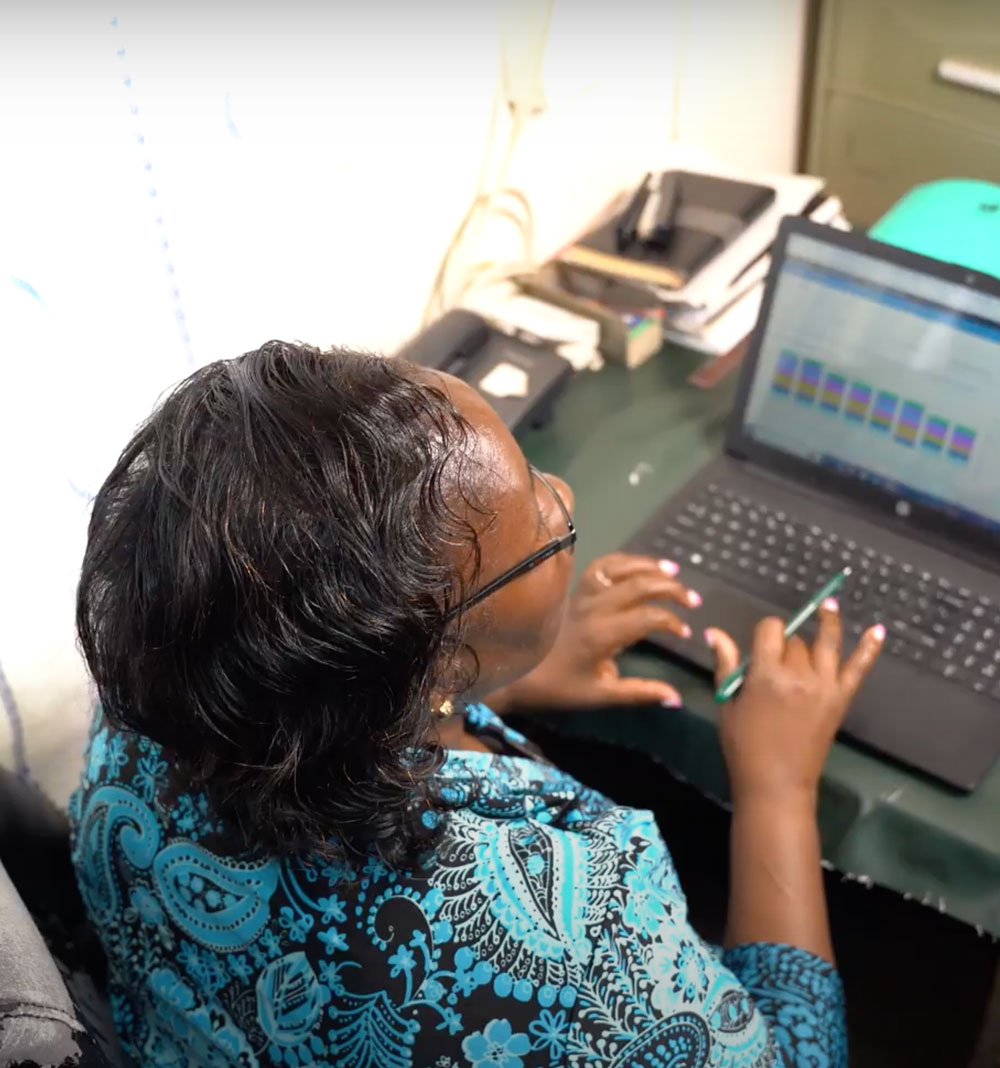
In the past three months, nurse Jedida has had better visibility over service delivery gaps at her workplace, Kibwezi Hospital. She routinely logs in to a set of real-time dashboards that help her identify gaps in prenatal check-ups, disrespectful care, and infant immunization, among other metrics. Jedida noticed a rising number of mothers reporting long waiting times, and identified staff shortages as a leading driver. Her manager Syliva had access to the same dashboards and, together, they mobilized a plan, hiring nurses to cover the shortages. Jedida has already seen a reduction in reports of long waiting times.
County Reproductive Health Coordinator Caroline Macharia helped Jacaranda co-design dashboards to give her and her colleagues better visibility into the gaps hindering timely maternal care in Murang’a County.
Find Us
788 Jabavu Rd Nairobi Nairobi County Kenya
Disclaimer
This website discusses pregnancy and motherhood. While we use the term “mother” to mirror the language of the community we are collaborating with, we also acknowledge that not all pregnant people identify as “mothers.” We would like to recognize that pregnancy and motherhood can be experienced by people of all genders.